Posts Tagged ‘startup’
Value-Driven Metrics: Finding Product-Market Fit
Posted by thomaslotze in Analytics on May 31st, 2012
Everyone loves product-market fit. Â Eric Ries writes and speaks about it in the lean startup. Paul Graham simply says to make something people want. But how do we find product-market fit? How do we find out what people actually want?
As a data analyst, I ask myself: how do we quantify this and measure it?
The answer, I’m finding, is the idea of value-driven metrics.
To explain, when first building a product, people try to figure out what, out of all the possible things could be built, do people find valuable. Trying to identify product features and functionality that users will find valuable enough to come back again and again. Initially, the startup has to have some sense of what users will find useful in the site. But, startups usually have a number of useful features identified, and so they provide users a number of choices as to how to use a site.
For one example, in building an online game, users might be able to develop their resources; they could go on quests; or they could choose to interact with their friends. It would be really useful to know which of those things people actually care about: which of them will bring people back?
To shorten the discovery period, we’ve started to map all of the actions someone could take, and group them into different clusters based on the value proposition of the site. For learnist, we consider four categories: browsing (finding things of interest to learn more about); supporting boards (content) by means of comments, likes, or shares; learning from a board; or teaching by creating or developing new boards.
As Learnist users visit our site or application, we log every time they do something that might be counted as one of those actions. More importantly, we then look at the times when users are actually returning to the site. For every return visit, we look at everything measured from that visit and see which activities they attempted. We evaluate all of the return visits, to determine what percent of those return visits actually contained one of these actions.
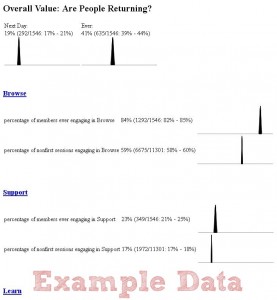
Essentially, what we’re evaluating is this: when people are coming back to the site, why are they coming back to the site? What do they find valuable? Putting this into a graphical display looks something like this (with example data):
At the top are two key metrics for user return rates overall: How many are returning the next day and ever. Then for each value we’re offering, we look at how many people are ever making use of the feature (availability) and also what percent of non-first-time (returning) sessions use that feature at least once.
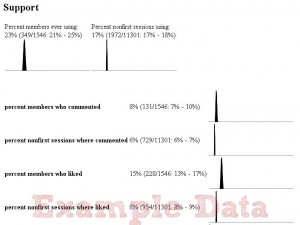
The example table shows what the value is, a text summary, and an estimated distribution (for fellow statisticians, it’s just a simple beta-binomial posterior). From this high-level view, we can drill down a little bit and see, within a given Value, what specific actions people are taking when they return. It’s a good way to figure out what features people are actually using, or not using, so we can either focus on them, drop them, or try a new iteration on them.
With more example data, we can see that “support†includes commenting and liking (as well as additional actions as one scrolls down).
I see this as an actionable metric for the strategy level: It tells us what areas we should be focused on, once we’ve found something people are really responding to.
Of course, there’s definitely more refinement to be made here as we get beyond our early adopters: we should convert this over to cohort data, develop an estimate of where our baseline is, and see where the recent cohorts of users are as compared to that baseline. Very quickly, we’ll want to view these metrics based on where the users are coming from the referring site) and demographics, so that we can understand what different types of users find valuable. We may also want to include a per-user factor; right now these metrics are biased towards whatever power users like, rather than what the larger group of returning users likes, and this may not always be what we’re looking for.
But I think this is a good place to start: if you want to know why your users are coming back, measure what they do when they come back.
(This post is also cross-posted on the Grockit blog.)

